Insight into the chemomechanical coupling mechanism of kinesin molecular motors

|
Insight into the chemomechanical coupling mechanism of kinesin molecular motors |
| Ping Xie |
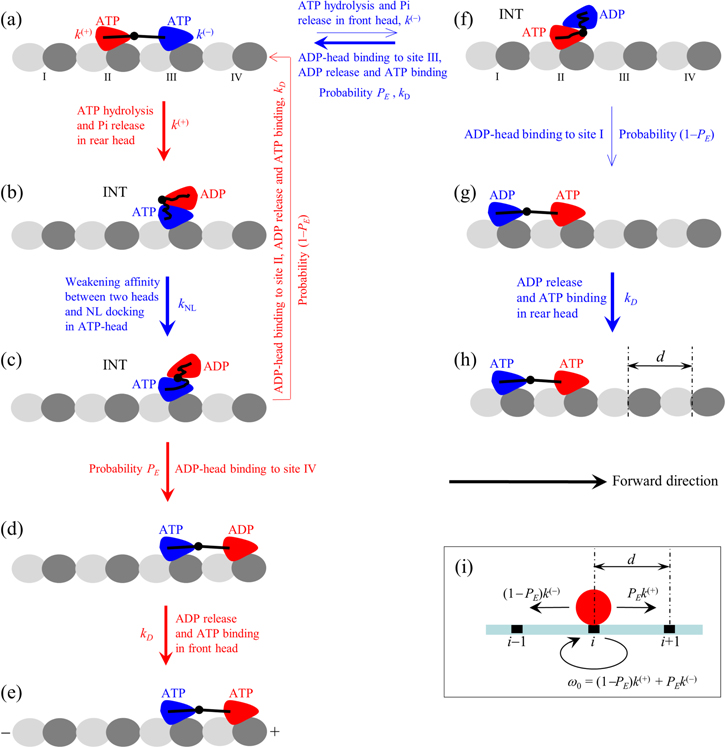
| Figure 2. Schematic illustrations of BR model. (a)–(h) The chemomechanical coupling pathway at saturating ATP (see text for detailed description). The thickness of the arrow represents the magnitude of the transition probability under no load. Since in both ATP and ADP.Pi state the head binds strongly to MT, for simplicity, ATP hydrolysis and Pi release are drawn here as one step, with symbol ATP representing both ATP and ADP.Pi states and the transition from ATP to ADP consisting of two sequential transitions of ATP to ADP.Pi and of ADP.Pi to ADP. (i) The simplified model derived from the pathway shown in (a)–(h). The red circle represents the center of mass of the dimer. The positions of binding sites on the MT filament are denoted by …, (i – 1), i, (i + 1), …. The motor can step forward and backward with rates PEk(+) and (1 – PE)k(−), respectively, where PE is effective chemomechanical coupling probability, and k(+) and k(−) are rates of ATP hydrolysis and Pi release of the rear and front heads, respectively. |

|