Insight into the chemomechanical coupling mechanism of kinesin molecular motors

|
Insight into the chemomechanical coupling mechanism of kinesin molecular motors |
| Ping Xie |
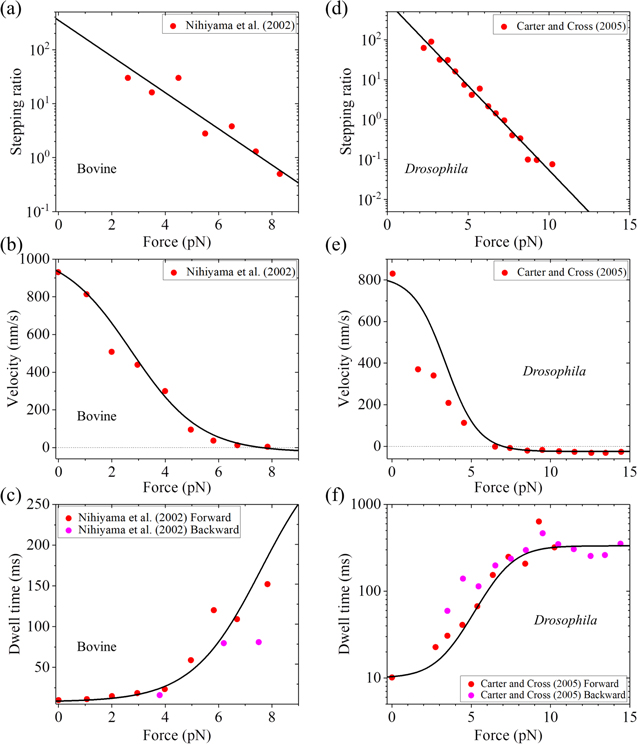
| Figure 3. Comparisons between theoretical results obtained based on BR model and experimental data for different species of kinesin. Lines are theoretical results, and symbols are experimental data at saturating ATP (1 mM). Left panels (a)–(c) are for bovine brain kinesin, with the theoretical results calculated with parameter values given in table |

|