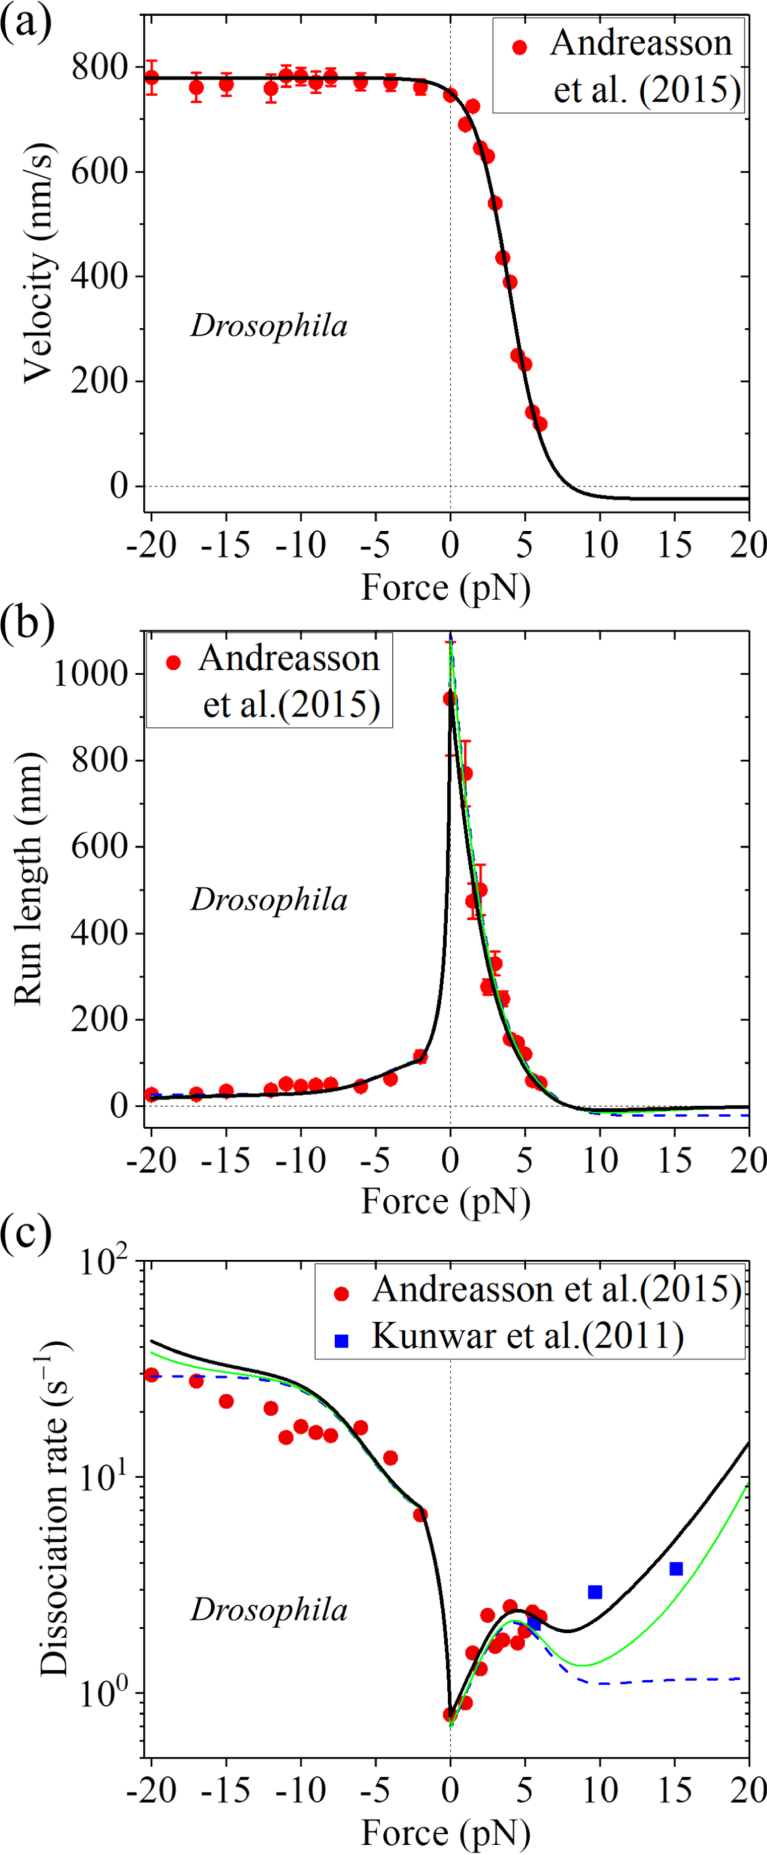
Figure 5. Comparisons between theoretical results obtained based on BR model and experimental data for Drosophila kinesin. Lines are theoretical results calculated with parameter values given in table 1 under experimental condition of Andreasson et al [26], and symbols are experimental data at saturating ATP (2 mM) taken from Andreasson et al [26] and Kunwar et al [74]. (a) Velocity versus load. (b) Run length versus load. (c) Dissociation rate versus load. The experimental data of Andreasson et al [26] (circles) shown in (c) are obtained by dividing data of velocity shown in (a) by the corresponding data of run length shown in (b). As used in the single-molecule optical trapping experiments of Andreasson et al [26], the radius of the bead is taken as RB = 0.22 μm here. To be consistent with the measured dissociation rate of about 45 ${{\rm{s}}}^{-1}$ under very large backward load Fx = 25 pN by Andreasson et al [26], from equation (16) it is noted that only one parameter, e.g. ${\varepsilon }_{{\rm{s0}}}$ is adjustable while the other parameter ${\delta }_{s}$ can be determined. Blue, green and black lines in (b) and (c) are results calculated with ${\varepsilon }_{{\rm{s0}}}$ 0, ${\varepsilon }_{{\rm{s0}}}$ 0.01 ${{\rm{s}}}^{-1}$ and ${\varepsilon }_{{\rm{s0}}}$ 0.1 ${{\rm{s}}}^{-1},$ respectively.
|

