Modeling the roles of 14-3-3 Σ and Wip1 in p53 dynamics and programmed cell death*

|
Modeling the roles of 14-3-3 Σ and Wip1 in p53 dynamics and programmed cell death* |
| Nan Liu(刘楠),Hongli Yang(杨红丽),Liangui Yang(杨联贵) |
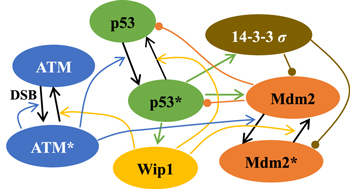
| Figure 1. Schematic diagram of the network model. Promotion and state transition is represented by colored and black arrow-headed lines respectively. The promotion of degradation is indicated by cycle-headed lines. |

|