Modeling the roles of 14-3-3 Σ and Wip1 in p53 dynamics and programmed cell death*

|
Modeling the roles of 14-3-3 Σ and Wip1 in p53 dynamics and programmed cell death* |
| Nan Liu(刘楠),Hongli Yang(杨红丽),Liangui Yang(杨联贵) |
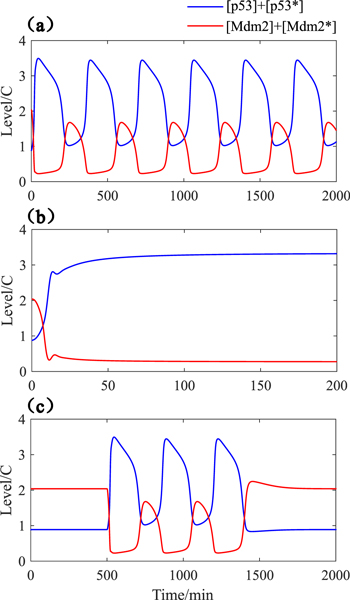
| Figure 2. Time evolution diagram of total p53 (blue line) and total Mdm2 (red line). (a) kpatm = 0.25; (b) kpatm = 0.5; (c) kpatm = 0.25 if $t\in [500,1400]\quad \min $, else, kpatm = 0. |

|