Modeling the roles of 14-3-3 Σ and Wip1 in p53 dynamics and programmed cell death*

|
Modeling the roles of 14-3-3 Σ and Wip1 in p53 dynamics and programmed cell death* |
| Nan Liu(刘楠),Hongli Yang(杨红丽),Liangui Yang(杨联贵) |
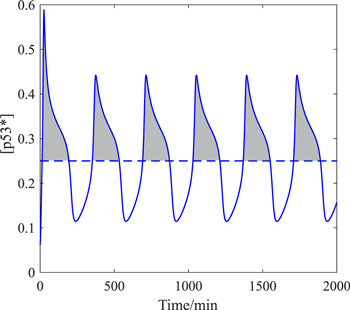
| Figure 8. The schematic diagram of ECP, the blue solid line is the time history of p53*, the blue dashed line is the threshold Th, and the gray area is the accumulation of p53 that is conducive to apoptosis. |

|