Balanced biosynthesis and trigger threshold resulting in a double adder mechanism of cell size control

|
Balanced biosynthesis and trigger threshold resulting in a double adder mechanism of cell size control |
| Leilei Li |
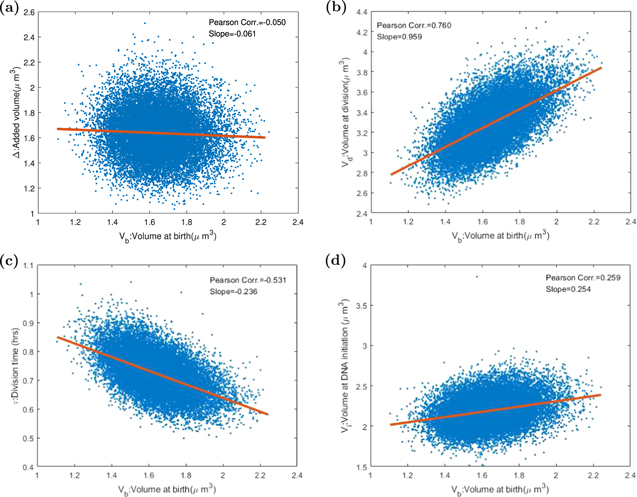
| Figure 6. The Pearson correlation coefficients and slopes between various variables in the division-centric picture. Each point stands for one cell in 20 000 consecutive divisions after the system gets into the steady state. The red line is the linear fitting curve. (a) The X-axis refers to the cell birth volume, and the Y-axis refers to the increased volume during the division cycle. In the ideal adder model, the correlation coefficient of Vb and Δ should be 0. Our result is −0.050, so that add property is proved in our model. (b) The correlation coefficient of Vb, volume at birth time, and Vd, volume at division time, is 0.760. The slope of the fitting curve is about 1. (c) The doubling time τ is negatively correlated with birth size. In the ideal adder model, the correlation coefficient should be −0.5, compared with our model −0.531. (d) The replication initiation size Vi is positively correlated with Vb with the correlation coefficient being 0.259. If Donchie’s hypothesis is correct, the value should be 0. |

|