Quantum correlations and optical effects in a quantum-well cavity with a second-order nonlinearity

|
Quantum correlations and optical effects in a quantum-well cavity with a second-order nonlinearity |
| H Jabri |
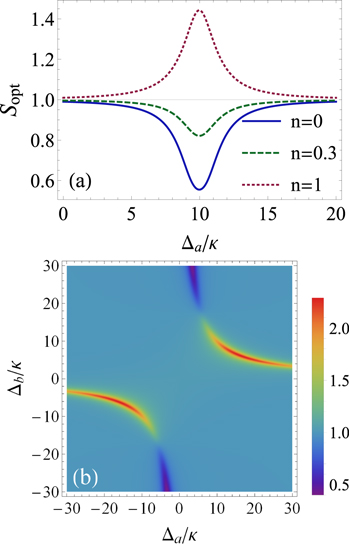
| Figure 5. The squeezing spectrum plotted versus the frequency detunings. (a) Sopt as a function of Δa/κ for Δb = 10κ and some values of the thermal exciton mean number. (b) Density plot of Sopt as a function of Δa/κ and Δb/κ for n = 1.5. The other parameters are set to γ = κ, λ = 0.5κ, and g = 10κ. Even though the temperature elevation tends to destroy the squeezing, there are two frequency zones that exhibit higher resistance to this effect than the others. |

|