Optical soliton in a one-dimensional array of a metal nanoparticle-microcavity complex

|
Optical soliton in a one-dimensional array of a metal nanoparticle-microcavity complex |
| Ning Ji,Tao Shui,Yi-Lou Liu,Wang-Rui Zhang,Xiu-Mei Chen,Wen-Xing Yang |
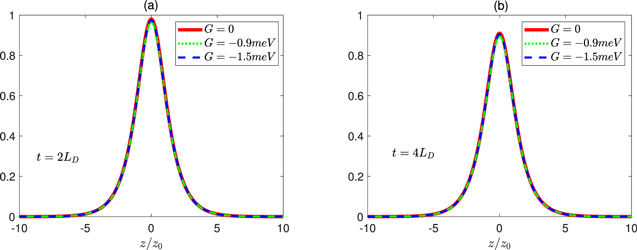
| Figure 3. Comparison of the cavity field distribution $| {a}_{j}/{U}_{0}{| }^{2}$ for several different values of G. (a) t = 2LD and (b) t = 4LD, for G = 0 (solid red line); G = −0.9 meV (dotted green line), and G = −1.5 meV (dashed blue line). The other parameters are the same as those shown in figure |

|