Examination of n - T9 conditions required by N = 50, 82, 126 waiting points in r-process

|
Examination of n - T9 conditions required by N = 50, 82, 126 waiting points in r-process |
| Nguyen Duy Ly,Nguyen Ngoc Duy,Nguyen Kim Uyen,Vinh N T Pham |
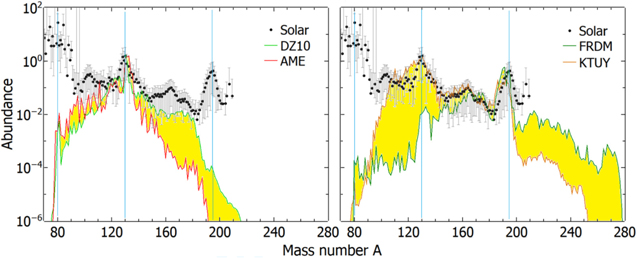
| Figure 7. The r-process abundances of isotopes calculated using the nn − T9 conditions based on the AME, DZ10, FRDM, and KTUY mass data sets. Notice that the calculated abundances are upscaled by a factor of 1000 to normalize with the A = 130 peak of the Solar abundance which is taken from [ |

|