How polar hydroxyl groups affect surface hydrophobicity on model talc surfaces

|
How polar hydroxyl groups affect surface hydrophobicity on model talc surfaces |
| Zhuangzhuang Chen,Chonghai Qi,Xuepeng Teng,Bo Zhou,Chunlei Wang |
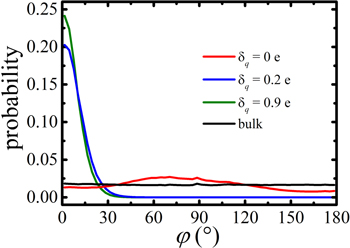
| Figure 4. Distribution of the angle φ between the dipole orientation of the water molecules in the first layer and the surface normal direction (z direction). The red, blue and olive curves correspond to δq = 0 e, δq = 0.2 e and δq = 0.9 e, respectively. The dipole distribution of the bulk water molecules is shown in black. |

|