Out-of-time-ordered correlation in the anisotropic Dicke model

|
Out-of-time-ordered correlation in the anisotropic Dicke model |
| Jihan Hu(胡继晗),Shaolong Wan(完绍龙) |
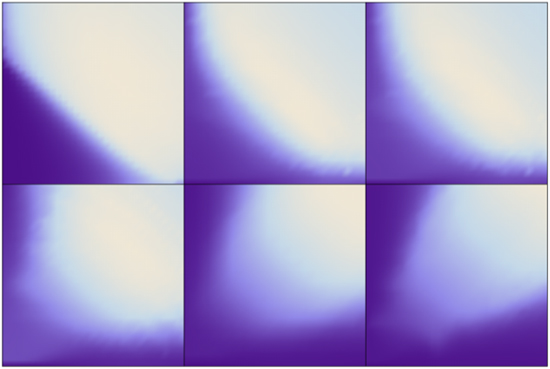
| Figure 6. Density plot of $\bar{{ \mathcal R }}$ as a function of g1,2 with T = 0, 1, 1.43, 3.33, 10, ∞ respectively. Although the legends of each density plot are different, they do not matter and are left out for simplicity. |

|