


1. Introduction
Among high-temperature materials, transition metal silicide (TMS) is a very promising high-temperature structural material, which has a stronger development prospect than the traditional nickel-based materials [1–6]. In recent years, TMS has received more and more attention because of its excellent thermoelectric performance, low cost and good physical and chemical properties [7–11]. Especially, molybdenum silicides have relatively low density (6240 kg m−3), a high melting point (2020 °C), excellent oxidation resistance, high thermal conductivity and thermodynamic compatibility and are increasingly popular with researchers [12]. The thermodynamic properties of Mo–Si-B alloys were predicted by Hutter et al [13]. The correlation between the mechanical instability of MoSi2 undergoing a semi-metallic-to-metallic phase transition and phonons is evaluated under simulated conditions in a highly restricted region. Additionally, Xu et al investigated the plasticity of the cubic A15-structured Mo3Si, and concluded that the addition of a ‘coarse grain’ Mo phase improves the corrosion resistance and hardness of the overall Mo3Si nanocrystalline coating [14]. Furthermore, Chen et al pointed out that the addition of Al2O3 not only reduced the friction coefficient and specific wear rate of Mo5Si3–Mo3Si–Al2O3 composites but also obtained excellent properties including finer organization, higher strength, higher fracture toughness and higher hardness [15]. Pan et al studied the crystal structure, elastic properties, elastic anisotropy and thermodynamic properties for Mo5Si3 with different structures [16]. Unfortunately, the poor ductility and toughness of Mo5Si3 at ambient temperatures is a serious impediment to their wider development in the industry.
The crystal structure and atomic-level defect behavior determine the mechanical properties of the structural material. There are different defects (vacancies, impurities, dislocations, interfaces, etc) in any entity. Among these defects, vacancies, as an intrinsic defect of crystal structure, can effectively change the physical properties and chemical properties of the material. Vacancies can form impurity traps in the crystal structure, which in turn affects the mechanical properties of the structural material. However, a comprehensive insight into the fracture mechanism is a challenge due to the complexity of the defects. For Mo5Si3, although there have been many experiments to study its defect behavior, the in-depth study of the vacancy mechanism has not been reported. We also studied the influence of oxygen atom occupancy on the electronic and mechanical behavior of Mo5Si3 silicides. Here, we systematically study the vacancy mechanism and oxygen occupation effects on the physical mechanism of Mo5Si3 by first-principles method. In order to analyze the stability of vacancy and oxygen substitution, the data of vacancy formation energy and enthalpy are calculated respectively. In addition, the effect of vacancy and oxygen occupation in Mo5Si3 on the mechanical properties is analyzed by electronic structure.
2. Theoretical methods
Here, all results are obtained with first-principles calculations using CASTEP code based on density functional theory [17–19]. The (GGA) with PBE functional is set to process the exchange-correlation functional [20–23]. The basis of calculation in this paper is a plane wave, in which the energy of the electrons attracted by the nucleus is handled by the ultrasoft pseudopotential [24–26]. The electronic configurations are 4d55s1, 3s23p2, 2s22s4 for molybdenum, silicon and oxygen respectively. The energy cutoff was set to be 550 eV to achieve convergence of the total energy. A grid of 4 × 4 × 8 k-points in the Brillouin region is sampled and the reciprocal space is integrated to obtain the total energy. The tolerances during the geometry optimization were set as follows: 5 × 10⁻⁶ eV/atoms for the total energy, 0.01 eV Å−1 for the maximum ionic force, 5.0 × 10⁻⁴ Å for the maximum ionic displacement and 0.02 GPa for the maximum stress. Broyden–Fletcher–Goldfarb–Shanno minimization algorithm was applied. A value of 5.0 × 10⁻⁷ Å was set as the self-consistent field tolerance. In the process of structural optimization, the atoms are neither stress-constrained nor symmetric and are in a state of complete relaxation [27–29]. The phonon dispersions were calculated by using the Phonon code.
The vacancy formation energy (Ef) determines the thermodynamic stability of the defective Mo5Si3. The equation about the vacancy formation energy is given by the following equation [30]:
$\begin{eqnarray}{E}_{\unicode{x00192}}={E}_{{\rm{vacancy}}}^{{\rm{X}}}-{E}_{{\rm{perf}}}^{{\rm{total}}}+{\mu }_{{\rm{X}}},\end{eqnarray}$
where ${E}_{{\rm{vacancy}}}^{{\rm{X}}}$ and ${E}_{{\rm{perf}}}^{{\rm{total}}}$ represent the total energy of Mo5Si3 with X (X = Si and Mo) vacancies and a perfect Mo5Si3, respectively. ${E}_{{\rm{X}}}$ (X = Si and Mo) represents the chemical potential of the vacant element. For molybdenum-rich regions, ${\mu }_{{\rm{Mo}}}={E}_{{\rm{Mo}}}\left({\rm{bulk}}\right),$ whereas for silicon-rich areas, ${\mu }_{{\rm{Si}}}={E}_{{\rm{Si}}}\left({\rm{bulk}}\right).$ Besides, ${E}_{{\rm{Mo}}}\left({\rm{bulk}}\right)$ and ${E}_{{\rm{Si}}}\left({\rm{bulk}}\right)$ are the total energy in the Mo block and Si block system, respectively.Except for vacancy formation energy, both thermodynamic and dynamic data determine the structural stability of the solid [31–33]. The thermodynamic stability is mainly related to the chemical potential between atoms, which is determined by the enthalpy of formation (ΔH) [34, 35]. Therefore, to investigate the thermodynamic stability of Mo5Si3 with vacancy defects, the calculation of the formation enthalpy can be expressed by:
$\begin{eqnarray}{\rm{\Delta }}H\left({{\rm{Mo}}}_{x}{{\rm{Si}}}_{y}\right)=\displaystyle \frac{1}{x+y}\left({{E}}_{{\rm{total}}}\left({{\rm{Mo}}}_{x}{{\rm{Si}}}_{{\rm{y}}}\right)-x{{E}}_{{\rm{Mo}}}-y{{E}}_{{\rm{Si}}}\right),\end{eqnarray}$
where ${E}_{{\rm{total}}}\left({{\rm{W}}}_{x}{{\rm{Si}}}_{y}\right),$ ${E}_{{\rm{Mo}}}$ and ${E}_{{\rm{Si}}}$ represent the total energy of the compound ${{\rm{Mo}}}_{x}{{\rm{Si}}}_{{\rm{y}}},$ elemental molybdenum and silicon in the ground state; x and y denote the number of Mo and Si atoms in the ${{\rm{Mo}}}_{x}{{\rm{Si}}}_{{\rm{y}}}.$To explore the thermodynamic stability of the O-occupied Mo5Si3, the formation enthalpies of four oxygen occupied models (O–Mo1, O–Mo2, O–Si1, O–Si2) are calculated by the following equation
$\begin{eqnarray}\begin{array}{l}{\rm{\Delta }}H\left({{\rm{Mo}}}_{m}{{\rm{Si}}}_{n}{\rm{O}}\right)=\displaystyle \frac{1}{m+n+1}\left({E}_{{\rm{total}}}\left({{\rm{Mo}}}_{m}{{\rm{Si}}}_{n}{\rm{O}}\right)\right.\\ \,\,\,\,\,\,\,\,-\,\left.m{E}_{{\rm{Mo}}}-n{E}_{{\rm{Si}}}-{E}_{{\rm{o}}}\right),\end{array}\end{eqnarray}$
where ${E}_{{\rm{total}}}\left({{\rm{W}}}_{m}{{\rm{Si}}}_{n}{\rm{O}}\right),$ ${E}_{{\rm{Mo}}}$ and ${E}_{{\rm{Si}}}$ represent the total energy of the O-occupied Mo5Si3, elemental molybdenum and silicon in the ground state; m and n are the number of Mo and Si atoms in the O-occupied Mo5Si3, respectively.As is known to all, the key parameter for studying the application of high-temperature materials in the industry is the mechanical properties [36–38], which are determined by the elastic constants and elastic modulus. The elastic hardness, the volume deformation resistance and the shear deformation resistance are exhibited by Young’s modulus, the bulk modulus, the shear modulus, respectively [39–41]. The elastic constants are computed by the stress–strain method [42–44] and mechanical stability is determined by [45]:
$\begin{eqnarray}\begin{array}{l}{C}_{11}\gt 0,{C}_{33}\gt 0,{C}_{44}\gt 0,{C}_{66}\gt 0,{C}_{11}-{C}_{12}\gt 0,\\ {C}_{11}+{C}_{33}-2{C}_{13}\gt 0,\\ 2\left({C}_{11}+{C}_{12}\right)+{C}_{33}+4{C}_{13}\gt 0.\end{array}\end{eqnarray}$
The bulk modulus and shear modulus were calculated by using the Voigt–Reuss–Hill approximation method according to the elastic constants [46]. Then, Young’s modulus was calculated by:
$\begin{eqnarray}E=\displaystyle \frac{9BG}{3B+G}.\end{eqnarray}$
3. Results and discussion
3.1. Structural stabilities
Figure 1 shows the sites of different vacancies in Mo5Si3 for the investigation of vacancy and oxygen occupancy. Before exploring the oxygen occupancy mechanism, the stability of the vacancies is studied. Table 1 lists the lattice constants, vacancy formation energies, and enthalpies of formation for vacancy-deficient Mo5Si3, together with perfect Mo5Si3. The general trend is that a negative value for the vacancy formation energy is indicative of the thermodynamic stability of the ground state. In particular, the smaller vacancy formation energy corresponds to the more stable the thermodynamic properties. According to table 1, the vacancies of four different sites are thermodynamically stable because their vacancy formation energies are less than zero. Compared to Si vacancies, the Mo vacancies have a smaller value of vacancy formation energy, indicating that Mo vacancies have more stable thermodynamic properties in Mo5Si3. It is worth mentioning that Mo5Si3 is more prone to form Mo−Va2 vacancies, attributed to the calculated smaller vacancy formation energies (−0.838 eV) than the other vacancies. The reason may be the different types and locations of defective atoms.
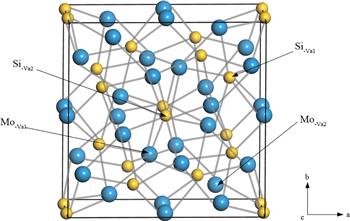
Figure 1. Crystal structure of Mo5Si3 with different vacancies. |
Table 1. Calculated lattice parameters, a, b and c (Å), vacancy formation energies, Eƒ (eV) and formation enthalpies ΔH (kJ mol−1) of Mo5Si3 with four different vacancies. |
| Method | a | b | c | Eƒ | ΔH | |
|---|---|---|---|---|---|---|
| Mo5Si3 | GGA | 9.690 | 9.690 | 4.942 | −35.48 | |
| Expa | 9.660 | 9.660 | 4.940 | |||
| Theob | 9.670 | 9.670 | 4.938 | −36.98 | ||
| Mo−Va1 | GGA | 9.637 | 9.681 | 4.935 | −0.826 | −35.12 |
| Mo−Va2 | GGA | 9.679 | 9.638 | 4.935 | −0.838 | −35.86 |
| Si–Va1 | GGA | 9.642 | 9.642 | 4.942 | −0.785 | −35.23 |
| Si–Va2 | GGA | 9.640 | 9.640 | 4.930 | −0.721 | −35.87 |
Furthermore, the formation enthalpy of these models is negative, which means that these models possess thermodynamic stability. As shown in table 1, the enthalpy of formation is negative for both the vacancy-deficient Mo5Si3 and the perfect Mo5Si3, indicating that they are in a thermodynamically stable state. Among the four vacancy defect models, the enthalpy of formation of the Si–Va2 vacancy is −35.87 kJ mol−1, which is smallest among these vacancies. The covalent weakness of Mo over Si stems from the intrinsic nature of the atom. Thus, the charge interaction between Si atoms is strengthened more than that between Mo and Si atoms. In other words, Si-Si bond is stronger than Mo–Mo bond. The presence of Mo vacancies enhances the local hybridization among the different Si atoms. And conversely, Si vacancies attenuate the charge migration between Si atoms, then strengthen the charge interference between Mo atoms. This is the factor that contributes to the Mo vacancies being more stable than the Si vacancies. Nevertheless, the magnitude of the interatomic hybridization is dependent on the location of the vacancies. Therefore, the discrepancy between the Mo–Va1 vacancies and Mo–Va2 is the factor that causes Mo–Va2 to enhance the local hybridization of Mo and Si atoms.
Furthermore, the structural information of the vacancies at four different sites in Mo5Si3 is analyzed and discussed to reveal the structural stability. From table 1, it can be seen that the lattice parameters of Mo5Si3 are a = 9.690 Å and c = 4.942 Å, and in good concordance with the available data [16, 47]. The generation of atomic vacancies causes the lattice shrinkage of Mo5Si3 as shown in table 1, which implies stronger inter-atomic interactions. Furthermore, although the lattice constant of Si–Va1 (c = 4.942 Å) is the same as the lattice constant of perfect Mo5Si3, the removal of Si atoms has a certain influence on the parent Mo5Si3.
Moreover, the stability of oxygen introduction in defective Mo5Si3 is discussed to further explore the oxygen occupation mechanism. Table 2 shows that the formation enthalpy of Mo5Si3 with oxygen occupation is less than zero, indicating that the four oxygen occupying models are thermodynamically stable. To gain insight into the nature of oxygen occupation, the crystal structures of the oxygen occupation models are further studied. As listed in table 2, the presence of O atoms in Mo–Va1 vacancy leads to lattice expansion of the parent Mo5Si3 along the a-axis, which is demonstrated by a larger lattice constant (a = 9.703 Å) in comparison with vacancy models and parent Mo5Si3. The lattice expansion produced by oxygen occupation contributes to the difference in the atomic radius because the atomic radius of oxygen is bigger than that of Mo. This result is confirmed by the weaker inter-atomic hybridization of O–Mo2 along the b-axis. Note that the calculated lattice parameter (c = 4.910 Å) of O–Si2 is smaller than that of Mo5Si3 with vacancies and parent Mo5Si3 in that the formation of O–Mo bond. Besides the thermodynamic data, it is necessary to examine the dynamic stability of vacancies and oxygen occupation for Mo5Si3. The absence of virtual phonon frequencies means that the dynamic stability [48–51]. Figure 2 shows that neither the defective Mo5Si3 nor the oxygen occupation for Mo5Si3 has imaginary phonon frequencies, indicating that these models are dynamically stable.
Table 2. Calculated lattice parameters, a, b and c (Å), vacancy formation energies, Eƒ (eV) and formation enthalpies ΔH (kJ mol−1) of four different oxygen occupancy models. |
| Method | a | b | c | ΔH | |
|---|---|---|---|---|---|
| O–Mo1 | GGA | 9.703 | 9.623 | 4.949 | −35.62 |
| O–Mo2 | GGA | 9.626 | 9.706 | 4.945 | −35.93 |
| O–Si1 | GGA | 9.605 | 9.609 | 4.999 | −35.69 |
| O–Si2 | GGA | 9.653 | 9.653 | 4.910 | −36.07 |
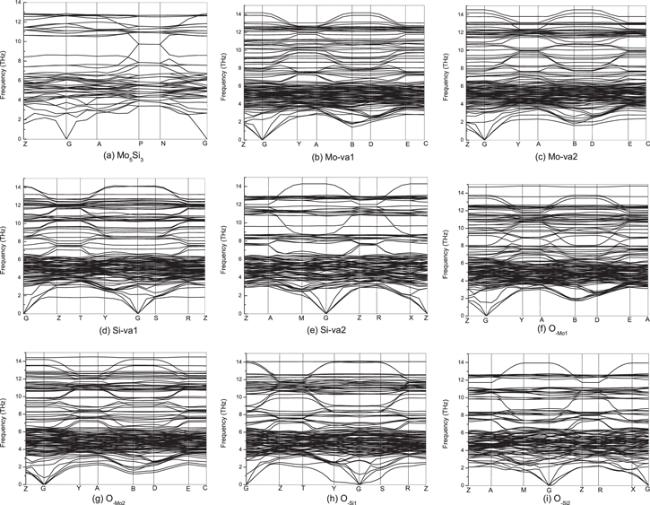
Figure 2. The phonon dispersion curves along the high-symmetry direction in the Brillouin zone for (a) perfect Mo5Si3, (b) Mo–Va1, (c) Mo–Va2, (d) Si–Va1, (e) Si–Va2, (f) O–Mo1, (g) O–Mo2, (h) O–Si1, (i) O–Si2, respectively. |
3.2. Mechanical properties
The strength of the solid material is determined by the elastic modulus, hardness and B/G ratio. Additionally, table 3 lists the elastic modulus, elastic constants, Vickers hardness and B/G ratio of defective Mo5Si3 and oxygen-occupied Mo5Si3, as well as perfect Mo5Si3. As shown in table 2, the modulus of elasticity and elastic constants are less than the previous theoretical results [52], which may be due to different calculation methods being adopted. In addition, the vacant and oxygen-occupied Mo5Si3 have mechanical stabilities in the ground state, together with the perfect Mo5Si3, because their elastic constants satisfy the equation (4 ) [53]. Besides, Mo5Si3 has a stronger deformation resistance along the a-axis than the c-axis from table 3, since the value of the elastic constant C11 is greater than C33 in perfect Mo5Si3. In addition, the existence of vacancies reduces the deformation resistance of Mo5Si3 along the a-axes and c-axes, because C11 and C33 of defective Mo5Si3 are smaller than those of the parent Mo5Si3. Particularly, the Si–Va2 vacancy has greater resistance to deformation along the a-axis compared to other vacancies as a result of the larger elastic constant C11 (380.0 GPa). Besides, it is clear that the elastic constant C33 (373.5 GPa) of Si–Va1 vacancy is largest among four vacancies, the resistance to deformation of Si–Va1 vacancy along the c-axis is greater among the four vacancies. The reason for this difference could be due to the interaction between the atoms. On the other hand, the calculated elastic constant of the Mo–Va2 (C44 = 92.4 GPa) is smaller than that of the other vacancies, resulting in a change in fracture toughness. The reason may be that the charge interactions between the atoms are weaker by the presence of the vacancies.
Table 3. Calculated elastic constants Cij (GPa), bulk modulus B (GPa), shear modulus G (GPa), Young’s modulus E (GPa), B/G ratio and Vickers hardness Hv (GPa) of Mo5Si3 with four different vacancies and four oxygen occupancy models. |
| Phase | C11 | C12 | C13 | C33 | C44 | C66 | B | G | E | B/G | Hv |
|---|---|---|---|---|---|---|---|---|---|---|---|
| Mo5Si3 | 412.0 | 159.6 | 137.4 | 376.3 | 103.1 | 134.1 | 229.4 | 118.3 | 302.8 | 1.94 | 12.0 |
| Theoa | 416 | 166 | 138 | 385 | 109 | 140 | 240 | 126 | 312 | 1.90 | 12.9 |
| Mo–Va1 | 371.1 | 135.1 | 150.6 | 354.3 | 93.5 | 92.7 | 212.7 | 103.6 | 267.4 | 2.05 | 10.0 |
| Mo–Va2 | 353.9 | 126.3 | 152.0 | 370.2 | 92.4 | 93.4 | 212.1 | 103.1 | 266.2 | 2.06 | 9.9 |
| Si–Va1 | 331.0 | 150.3 | 128.9 | 373.5 | 107.0 | 86.1 | 215.8 | 99.5 | 258.7 | 2.17 | 8.9 |
| Si–Va2 | 380.0 | 145.8 | 141.8 | 343.2 | 96.0 | 102.4 | 217.7 | 103.5 | 268.0 | 2.10 | 9.6 |
| O–Mo1 | 382.4 | 145.3 | 129.8 | 344.2 | 93.1 | 117.9 | 215.1 | 107.6 | 276.7 | 2.00 | 10.7 |
| O–Mo2 | 385.6 | 131.6 | 145.5 | 398.3 | 92.9 | 93.9 | 215.7 | 108.0 | 277.7 | 2.00 | 10.8 |
| O–Si1 | 345.8 | 139.3 | 137.5 | 365.3 | 125.4 | 90.0 | 222.1 | 107.1 | 276.8 | 2.07 | 10.1 |
| O–Si2 | 382.4 | 159.0 | 158.2 | 335.8 | 80.4 | 113.5 | 227.5 | 95.4 | 251.1 | 2.38 | 7.4 |
Reference [16]. |
To explore the influence of vacancies on the mechanical properties of Mo5Si3, the elastic moduli are investigated in detail. The calculated shear modulus and volume modulus of Mo5Si3 with vacancy defects are less than those of perfect Mo5Si3. In addition, table 3 shows that the volume modulus of Mo–Va is less than that of Si–Va, which explains the greater resistance to volume deformation in the case of Si atom disappearance, indicating the stronger stability of Mo vacancies. This variation is owed to the contribution of valence electrons between the Mo and Si. Furthermore, the Si–Va1 diminishes the electric charge interaction between atoms, which is attributed to a smaller shear modulus (99.5 GPa) compared to the other vacancies. The Young’s modulus of a given material determines its elastic stiffness. And the tendency is generally that the larger Young’s modulus, the larger the elastic hardness. Table 3 shows that Young’s modulus magnitudes are in the following order, Mo5Si3 > Si–Va2 > Mo–Va1 > Mo–Va2 > Si–Va1, which indicates that the presence of vacancies impairs the elastic stiffness of Mo5Si3. Further, the Mo vacancies possess stronger elastic stiffness than the Si vacancies.
The brittle or ductile behavior serves an integral role in high-temperature coatings. It is imperative to investigate the effect of vacancies on the brittle or ductile property of Mo5Si3. The brittle or ductile behavior of the material depends on Pugh’s rule [53]. If the B/G ratio is less than 1.75, the material behaves brittleness. On the contrary, the material demonstrates ductility if B/G > 1.75. Particularly, the larger B/G ratio corresponds to the better ductility. According to table 3 and figure 3, the B/G ratio of Mo5Si3 is more than 1.75, which indicates that Mo5Si3 is inherently ductile [47]. Simultaneously, Mo5Si3 with vacancy defects also exhibits ductile behavior. Moreover, the presence of vacancies enables Mo5Si3 to have better ductility. The calculated Vickers hardness of Mo5Si3 is 12.0 GPa, which contributes to the phenomenon that the removal of atoms results in the weakening of the Vickers hardness of Mo5Si3 because of the smaller Vickers hardness of Mo5Si3 with vacancy defects. In addition, the Mo–Va1 vacancy in Mo5Si3 has a larger Vickers hardness (10.0 GPa) in comparison with the other vacancy models, which has the higher values for Young’s modulus and shear modulus.
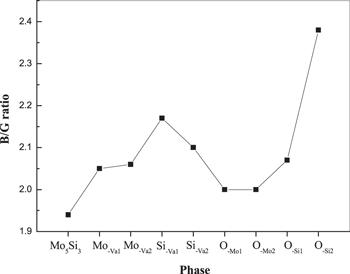
Figure 3. Calculated B/G ratio of Mo5Si3 with different vacancies and O-occupied Mo5Si3. |
The mechanical properties of Mo5Si3 with oxygen occupation are significantly different from those of Mo5Si3 with vacancies in several key respects. When oxygen is introduced into the defective Mo5Si3, it is obvious that C33 of the O–Mo2 model is higher than that of the parent Mo5Si3, indicating that the oxygen occupation Mo–Va2 site improves the deformation resistance of Mo5Si3 along the c-axis. Moreover, C44 of O–Si1 model is 125.4 GPa, which is larger than other oxygen occupation models and vacancy models, indicating that oxygen occupation the Si–Va1 site has stronger shear deformation resistance than the parent Mo5Si3. The result indicates that O occupation can improve the hybridization behavior between atoms. The diversification of the elastic constant is confirmed by the elastic modulus.
Table 3 shows that the elastic modulus (B, G, E) and Vickers hardness of oxygen occupation for Mo5Si3 models are lower than those of the parent Mo5Si3, indicating that the deformation resistance, elastic stiffness and hardness of the parent Mo5Si3 are weakened, which is consistent with vacancy mechanism. Nevertheless, the O-occupation for Mo5Si3 improves the ductility behavior of the parent Mo5Si3. Importantly, when O occupation for the Si–Va2 site, although the deformation resistance and hardness are weakened, the parent Mo5Si3 has excellent ductility properties compared to the other oxygen occupation for Mo5Si3 and Mo5Si3 with vacancy defects.
3.3. Electronic structure
To further explore the nature of the vacancy mechanism and the oxygen occupation mechanism, figure 4 shows the density of states (DOS) for Mo5Si3 with vacancy defects and oxygen-occupied Mo5Si3, as well as perfect Mo5Si3. In figure 4(a), the density of states near the Fermi level is mainly composed of Mo-4d, Mo-4p and Si-3p states. The local hybridization between Si and Mo results in the formation of Mo–Si bonds. The electrons migrate from Si-3s state to Si-3p state, and the local hybridization occurs to form Si–Si bonds between Si atoms. Moreover, the strong charge interaction between Mo and Si indicates that the Mo–Si bond is more stable, which is demonstrated by the shorter bond length of the Mo–Si bond (2.536 Å). There are a number of important differences in DOS between defective Mo5Si3 and perfect Mo5Si3. The formation of the vacancy is mainly shown in the detail near the Fermi level in figure 4. From figures 4(b) and (c), the depression near the Fermi level disappears, which corresponds to the transition of more electrons from the lower-level to the higher-level region, implying that the disappearance of Mo atoms gives the charges a stronger interaction with each other. This may be the reason why Mo vacancies have a stronger resistance to deformation. On the other hand, the removal of Si atoms results in many small peaks near the Fermi level, suggesting that more charges are transitioning to the Fermi level, which results in enhancing local hybridization between Mo atoms. Furthermore, oxygen occupation changes the electronic equilibrium near the Fermi level in Mo5Si3 from figure 4. When the Mo vacancy in Mo5Si3 is occupied by oxygen, the valley near the Fermi level is shallower, indicating that more electrons migrate to the higher-level region. As a result, the Mo–Va sites occupied by O atom enhance the interaction between O atom and its surrounding atoms. We suggest that the slight discrepancy about the DOS profile is contributed to the oxygen site in Mo5Si3. Compared with other oxygen-occupied sites, the oxygen-occupied Si–Va2 site leads to forming O–Mo bonds, due to the hybridization between O and Mo atoms, which may be the reason why the O–Si2 model has poor deformation resistance. The variation of interaction between charges is confirmed by the charge density difference.

Figure 4. The total and partial density of states (DOS) of Mo5Si3 with different vacancies and four different oxygen occupancy models, (a) Mo5Si3, (b) Mo–Va1, (c) Mo–Va2, (d) Si–Va1, (e) Si–Va2, (f) O–Mo1, (g) O–Mo2, (h) O–Si1, (i) O–Si2, respectively. |
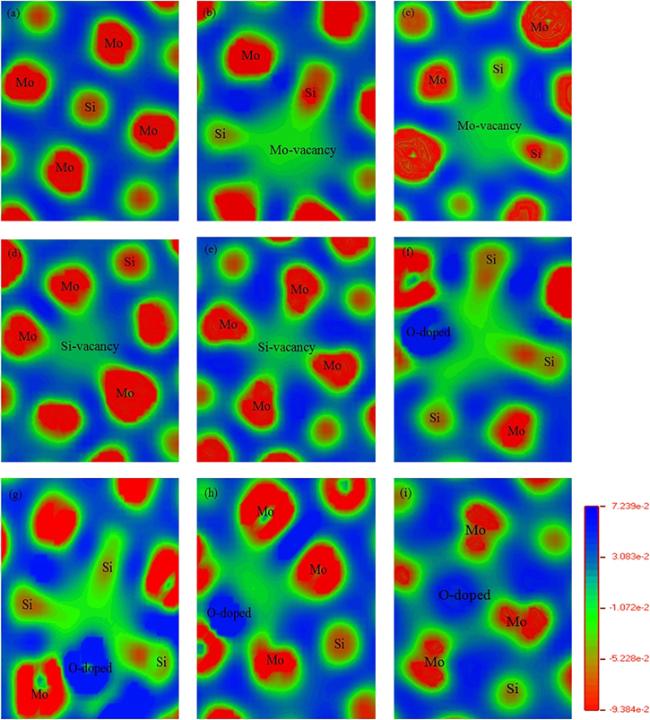
To explore the nature of the chemical bond state, the calculated charge density difference of the Mo5Si3 with four vacancies and oxygen-occupied Mo5Si3 are shown in figure 5. For the charge density distribution, the red region represents the maximum aggregation of electrons, while the blue region implies the maximum outlier of electrons. It can be observed from figure 5(a) that the Mo–Si bond and the Mo–Mo bond of the perfect Mo5Si3 are not defective. In particular, the Mo–Mo bond and the Mo–Si bond form a triangular bond, which improves the mechanical properties and structural stability of the Mo5Si3. When the Mo atom is removed, the local hybridization between Mo and Si is enhanced, in contrast to the Si vacancies which make the charge transfer between the Mo atoms stronger. This is the reason why the stability of Mo vacancies is higher. According to the electronic structure, the oxygen occupation mechanism is determined by the interaction between oxygen and various elements in Mo5Si3. Here, four oxygen-occupying models are further studied. For the O–Mo models, the oxygen atom is surrounded by three Mo atoms and three Si atoms. Meanwhile, the introduction of oxygen atoms in Mo vacancies makes Si atoms and Si atoms have a weaker charge interaction, that is, a weaker Si-Si bond is formed. However, the local hybridization between O and Si gives rise to a strong O–Si bond due to the presence of oxygen atoms, which may be the reason why the O–Mo models have poor ductility compared to Mo vacancies. When oxygen atoms occupy Si vacancies, the charge transfer between Mo atoms is enhanced, resulting in a stronger Mo–Mo bond. In particular, when O occupies the Si–Va2 site, the oxygen atom is surrounded by one Si atom and eight Mo atoms, forming eight weaker O–Mo bonds (the bond length is 2.573 Å) while the O–Si bonds disappear. This may be the inherent origin of the excellent ductility of the O–Si2 model.
Figure 5. The difference charge density contour plots of Mo5Si3 with four different vacancies and four different oxygen occupancy models along the (110) plane. (a) Mo–Va1, (b) Mo–Va2, (c) Si–Va1 and (d) Si–Va2, (f) O–Mo1, (g) O–Mo2, (h) O–Si1, (i) O–Si2, respectively. |
4. Conclusion
In summary, the effects of vacancy and oxygen occupation on the physical properties of Mo5Si3 are studied by first-principles calculations. According to the structural characteristics, four different vacancies (Si–Va1, Si–Va2, Mo–Va1, Mo–Va2) and oxygen occupation models (O–Mo1, O–Mo2, O–Si1, O–Si2) are selected for investigations, respectively. The conclusions as follows:
| (1)Mo5Si3 with vacancy defects or oxygen occupation is stable according to the obtain thermodynamics data and phonon frequencies. In particular, defective Mo5Si3 prefers to form Mo–Va2 vacancies. | |
| (2)The existence of vacancy leads to lattice contraction, while the O-occupation Mo–Va sites make the lattice expand due to the larger atomic radius of oxygen. | |
| (3)Although the existence of vacancies and oxygen weakens the deformation resistance and hardness of Mo5Si3, the O-occupied Si–Va2 site makes the Mo5Si3 have excellent ductile behavior, which stems from weaker O–Mo bonds. |